|
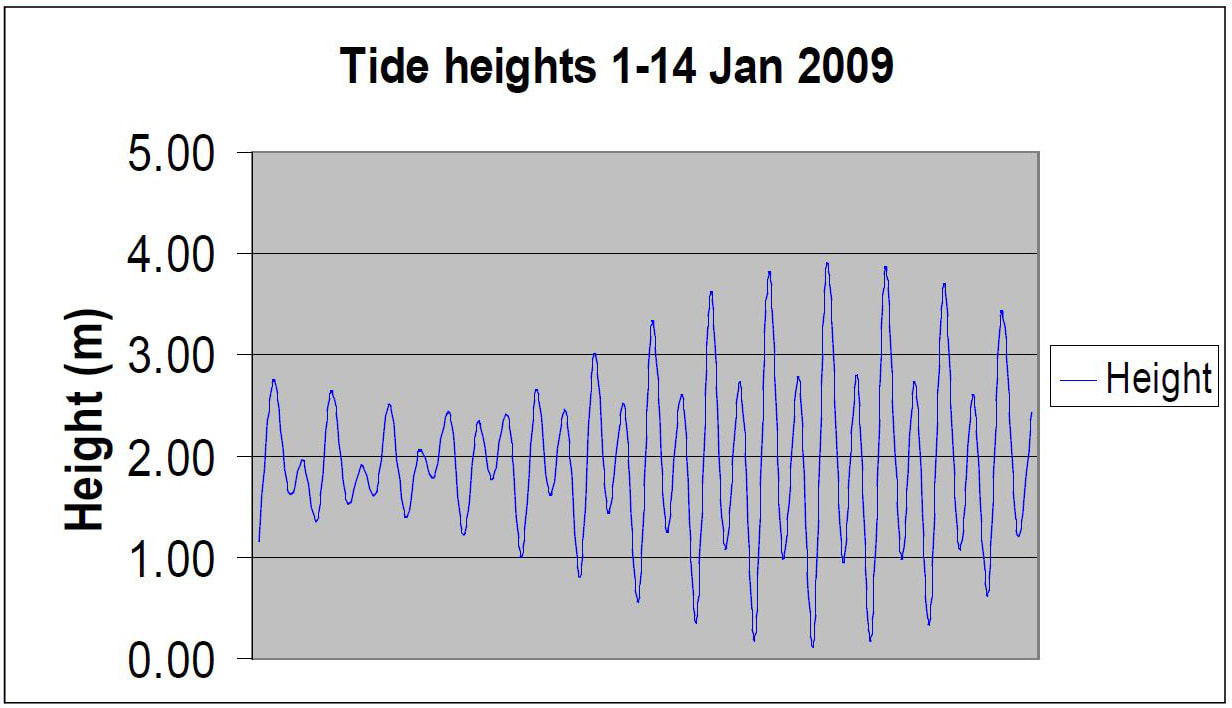
THREE GRAPHS and TABLE: DURATION OF NAVIGABLE WATER FOR TRAILERABLE VESSELS USING THE PUBLIC BOAT RAMP AT “PORT HINCHINBROOK” (OYSTER POINT NEAR CARDWELL) FOR EVERY LOW TIDE THROUGHOUT THE YEAR
The graphs illustrate that tidal range has little influence on how many times the tide drops below two metres. This is not surprising, because two metres is close to the depth at Mean Water. For craft of two metres draft there would be some period each day (including at night) when there would be insufficient water for convenient passage, affecting a minority of the yachts berthed in the privately owned “Port Hinchinbrook” marina. For vessels of one metre draft the available water is seldom too shallow to float. The underlying assumption is that the “Grande Canal” does not dry at heights above zero metres or LAT. This would be a “drying height”; not surprising in view of the original technical advice of the Queensland Harbours and Marine Department (1977). Should silting above LAT occur it would indicate that the boat ramp is simply in the wrong place. A possible solution would be to provide a second smaller boat ramp on the development site close to the mouth of Stoney Creek, for trailerable craft operators desirous of launching at low tide.
0 Comments
|
 RSS Feed
